Derivation
Skipping the tedious part of the derivation - very similar to the 1D, except we set $\mathbf E=(0,0,E_z)$ and $\mathbf{\tilde{H}}=(\tilde H_x,\tilde H_y,0)$, since these turn out to be the coupled equations (the other components become a ‘$H_z$’ mode).
The curl equations reduce therefore to:
And the update equations become:
(thanks ChatGPT).
Implementation
Free Space
Implemented materials, but haven’t added graphics/tested yet:
import numpy as np
import matplotlib.pyplot as plt
import scipy.integrate as spi
import matplotlib.animation as animation

N = 100  # Grid resolution
X, Y = 1.0, 1.0  # Domain size
dx, dy = X / N, Y / N  # Spatial steps
dt = 0.005  # Time step
T = 3.0  # Total time
c0 = 1.0  # Speed of light
rec_interval = 2  # Snapshot interval for animation

Hx, Hy = np.zeros((N, N-1)), np.zeros((N-1, N))  # Magnetic fields
Ez = np.zeros((N, N))  # Electric field

def create_gaussian_pulse(cx, cy, r, A=1.0):
    x = np.linspace(0, X, N)
    y = np.linspace(0, Y, N)
    X_grid, Y_grid = np.meshgrid(x, y)
    return A * np.exp(-((X_grid - cx)**2 + (Y_grid - cy)**2) / (2 * r**2))
Ez = create_gaussian_pulse(X/4, Y/4, 0.05, 1.0)

eps = np.ones((N, N))  # Permittivity
mu = np.ones((N, N))  # Permeability

def create_material(x0, x1, y0, y1, permittivity=1.0, permeability=1.0):
    global eps, mu
    i0 = int(np.floor(x0 / dx)); i1 = int(np.ceil(x1 / dx))
    j0 = int(np.floor(y0 / dy)); j1 = int(np.ceil(y1 / dy))
    i0, i1 = max(0, i0), min(N, i1)
    j0, j1 = max(0, j0), min(N, j1)
    eps[i0:i1, j0:j1] = permittivity
    mu[i0:i1, j0:j1] = permeability
MATERIALS = [
    # (0.4, 0.6, 0.4, 0.6, 4.0, 1.0),
]
for mat in MATERIALS:
    create_material(*mat)

# Compute average mu for H positions

mu_x = 0.5 * (mu[:, :-1] + mu[:, 1:])
mu_y = 0.5 * (mu[:-1, :] + mu[1:, :])

h_coeff_x = c0*dt/mu_x # Update coefficients for Hx
h_coeff_y = c0*dt/mu_y # Update coefficients for Hy
e_coeff = c0*dt/eps  # Update coefficients for E

def update(half_step):
    global Hx, Hy, Ez
    if half_step:
        Hx += -h_coeff_x * (Ez[:, 1:] - Ez[:, :-1]) / dy
        Hy += h_coeff_y * (Ez[1:, :] - Ez[:-1, :]) / dx
    else:
        Ez[1:-1, 1:-1] += e_coeff[1:-1, 1:-1] * (
            (Hy[1:, 1:-1] - Hy[:-1, 1:-1]) / dx -
            (Hx[1:-1, 1:] - Hx[1:-1, :-1]) / dy
        )
        Ez[0, :] = Ez[-1, :] = Ez[:, 0] = Ez[:, -1] = 0.0  # Dirichlet BC

def run_simulation(steps):
    global Hx, Hy, Ez, MATERIALS
    hist_Hx, hist_Hy, hist_Ez = [], [], []
    hist_Hx.append(Hx.copy())
    hist_Hy.append(Hy.copy())
    hist_Ez.append(Ez.copy())

    for step in range(steps):
        update(1)  # Half-step for H
        update(0)  # Full-step for E
        if (step+1) % rec_interval == 0:
            hist_Hx.append(Hx.copy())
            hist_Hy.append(Hy.copy())
            hist_Ez.append(Ez.copy())
    return hist_Hx, hist_Hy, hist_Ez

def center_H(Hx, Hy):
    Hx_c = np.zeros((N, N))
    Hy_c = np.zeros((N, N))
    if N > 2: Hx_c[:, 1:-1] = 0.5 * (Hx[:, 1:] + Hx[:, :-1])
    Hx_c[:, 0] = Hx[:, 0]; Hx_c[:, -1] = Hx[:, -1]
    if N > 2: Hy_c[1:-1, :] = 0.5 * (Hy[1:, :] + Hy[:-1, :])
    Hy_c[0, :]  = Hy[0, :]; Hy_c[-1, :] = Hy[-1, :]
    return Hx_c, Hy_c

def visualise(hist_Hx, hist_Hy, hist_Ez, show_H=False, save=False):
    fig, ax = plt.subplots()
    Xc, Yc = np.meshgrid(np.arange(N) * dx + 0.5 * dx, np.arange(N) * dy + 0.5 * dy)

    im = ax.imshow(hist_Ez[0].T, origin='lower', extent=(0, X, 0, Y),
                   cmap='RdBu', vmin=-1.0, vmax=1.0, interpolation='bilinear', zorder=1)

    quiv = None
    if show_H:
        quiver_scale = 10.0
        quiver_width = 0.002
        quiver_color = (0, 0, 0, 0.5)
        Hx_c0, Hy_c0 = center_H(hist_Hx[0], hist_Hy[0])
        quiv = ax.quiver(Xc, Yc, Hx_c0.T, Hy_c0.T,
                        scale=quiver_scale, pivot='mid', width=quiver_width, color=quiver_color, zorder=3)

    ax.set_xlabel('x'); ax.set_ylabel('y')
    ax.set_title('2D FDTD Simulation')
    ax.set_xlim(0, X); ax.set_ylim(0, Y)
    cb = plt.colorbar(im, ax=ax, fraction=0.046, pad=0.04)

    time_text = ax.text(0.02, 0.95, '', transform=ax.transAxes, color='k')

    def animate(i):
        im.set_array(hist_Ez[i].T)
        if show_H:
            Hx_c, Hy_c = center_H(hist_Hx[i], hist_Hy[i])
            quiv.set_UVC(Hx_c.T, Hy_c.T)
        time_text.set_text(f't = {i * dt:.4f}s')
        return [im, time_text] + ([quiv] if show_H else [])
    ani = animation.FuncAnimation(fig, animate, frames=len(hist_Ez), interval=10, blit=True)
    if save:
        ani.save('output.gif', writer='ffmpeg', fps=30)
    plt.show()

hist_Hx, hist_Hy, hist_Ez = run_simulation(int(T/dt))
visualise(hist_Hx, hist_Hy, hist_Ez, show_H=True, save=True)
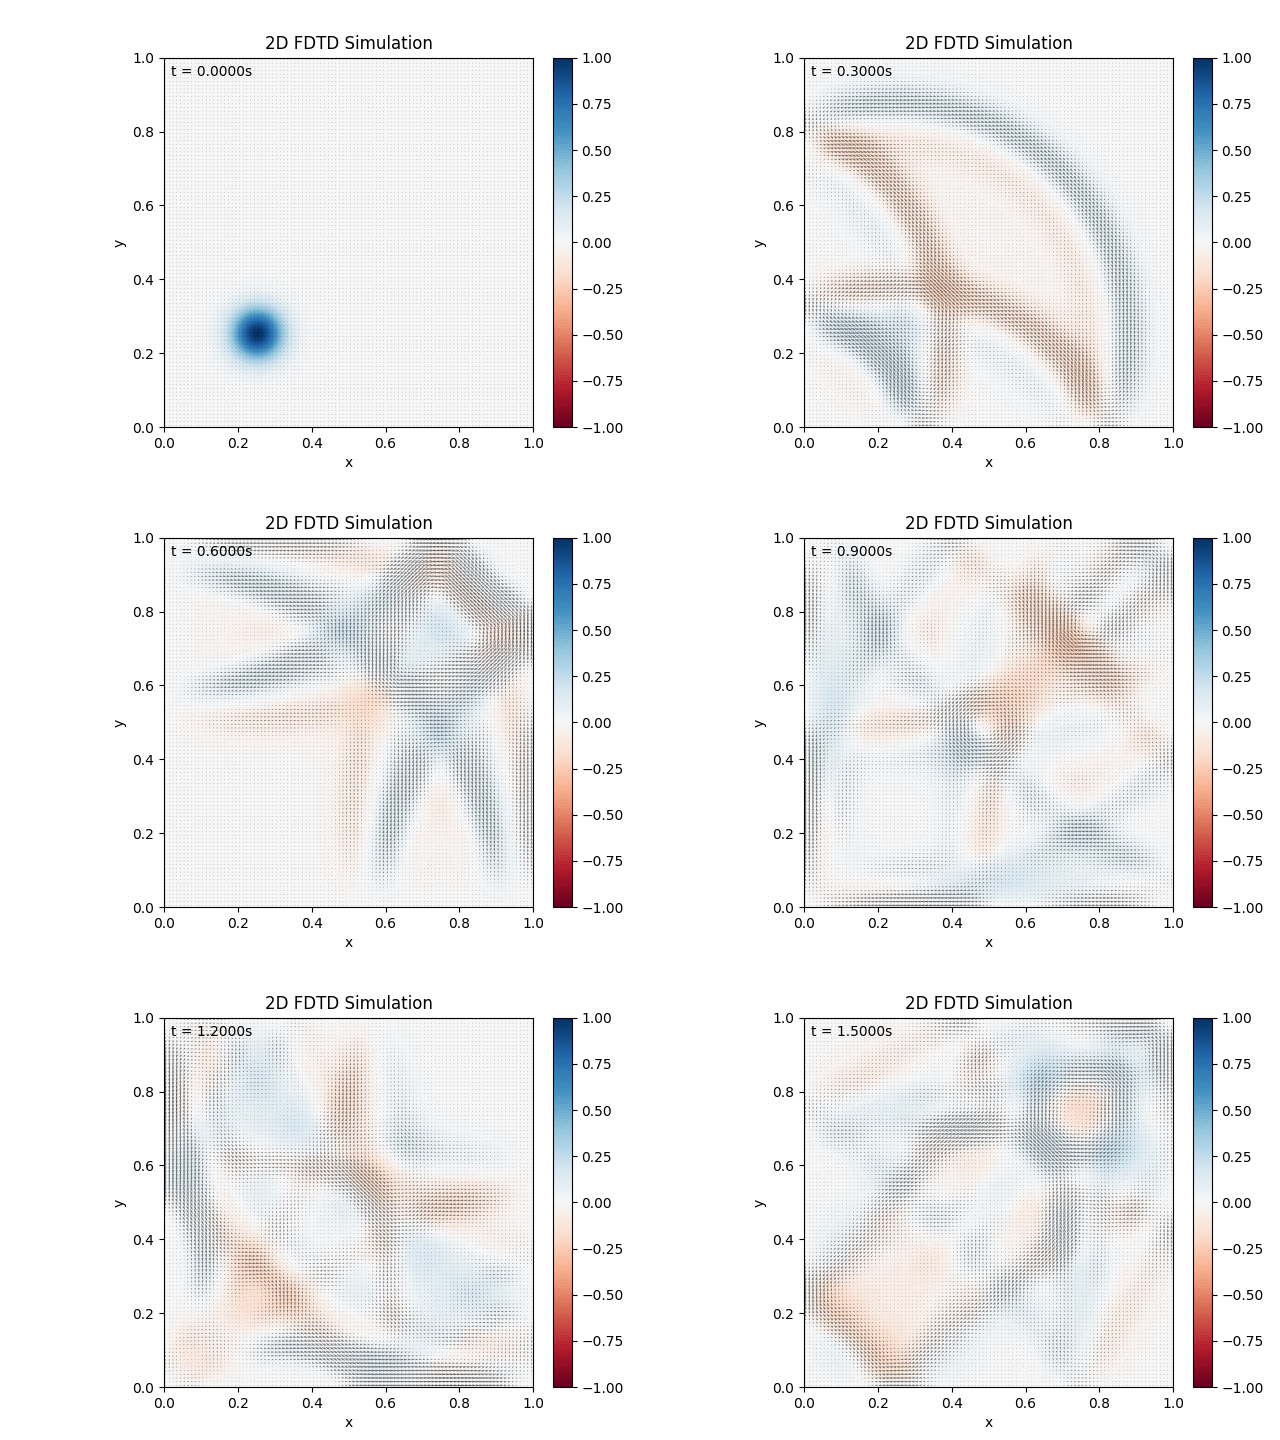
Creates the given output:

I’m pretty happy with this. $dt$ needs to be smaller to satisfy the CFL convergence condition. The black ‘dots’ are the magnetic field rendered as a vector field, just really small.
Materials Testing
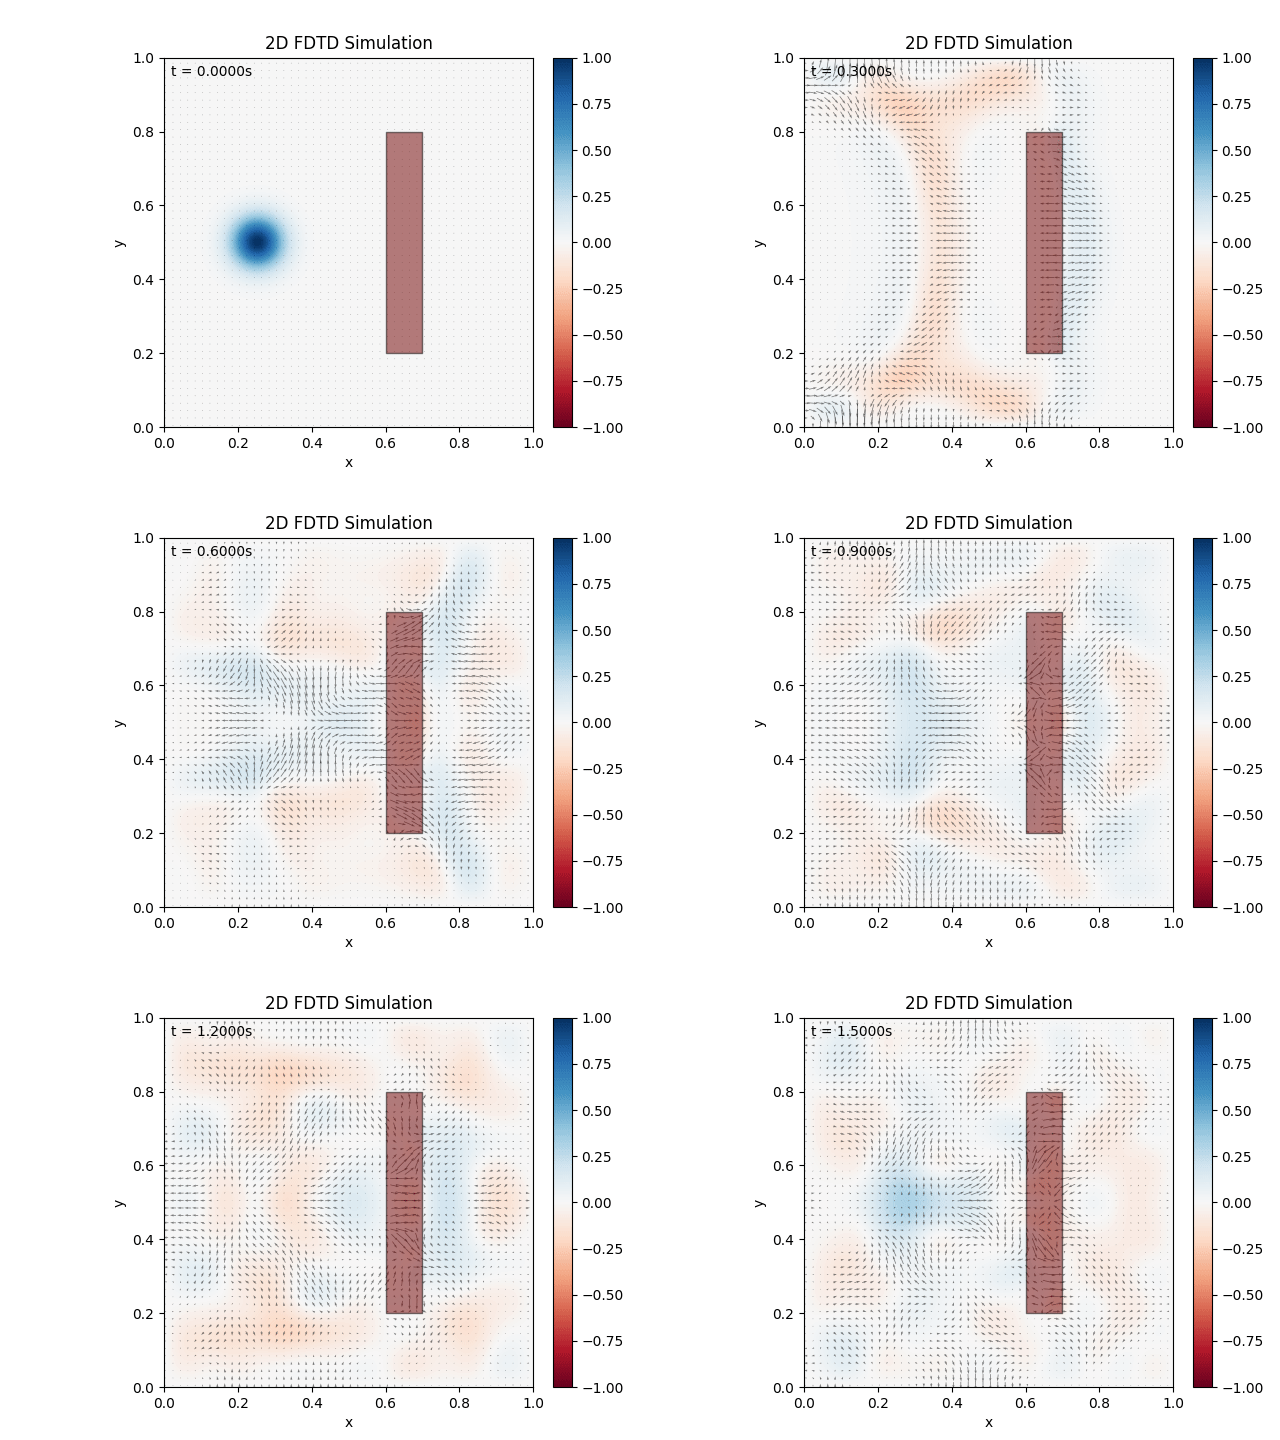
Not actually sure what happened, but turns out a lot of transpose/x/y things screwed up, so half the things (waves, etc.) were flipped while some other things (materials) rendered normally (i.e. not mirrored along $y=x$).
Either way, cleared up the mishap, adjusted visuals, and tested a material:
import numpy as np
import matplotlib.pyplot as plt
import matplotlib.animation as animation
from matplotlib.patches import Rectangle

N = 100  # Grid resolution
X, Y = 1.0, 1.0  # Domain size
dx, dy = X / N, Y / N  # Spatial steps
dt = 0.005  # Time step
T = 3.0  # Total time
c0 = 1.0  # Speed of light
rec_interval = 2  # Snapshot interval for animation

Hx, Hy = np.zeros((N, N-1)), np.zeros((N-1, N))  # Magnetic fields
Ez = np.zeros((N, N))  # Electric field

def create_gaussian_pulse(cx, cy, r, A=1.0):
    x = np.linspace(0, X, N)
    y = np.linspace(0, Y, N)
    X_grid, Y_grid = np.meshgrid(x, y)
    return A * np.exp(-((X_grid - cx)**2 + (Y_grid - cy)**2) / (2 * r**2))
Ez = create_gaussian_pulse(X/4, Y/2, 0.05, 1.0)

eps = np.ones((N, N))  # Permittivity
mu = np.ones((N, N))  # Permeability

def create_material(x0, x1, y0, y1, permittivity=1.0, permeability=1.0):
    global eps, mu
    i0 = int(np.floor(x0 / dx)); i1 = int(np.ceil(x1 / dx))
    j0 = int(np.floor(y0 / dy)); j1 = int(np.ceil(y1 / dy))
    i0, i1 = max(0, i0), min(N, i1)
    j0, j1 = max(0, j0), min(N, j1)
    eps[j0:j1, i0:i1] = permittivity
    mu[j0:j1, i0:i1] = permeability
MATERIALS = [
    (0.6, 0.7, 0.2, 0.8, 5.0, 1.0)
]
for mat in MATERIALS:
    create_material(*mat)

# Compute average mu for H positions

mu_x = 0.5 * (mu[:, :-1] + mu[:, 1:])
mu_y = 0.5 * (mu[:-1, :] + mu[1:, :])

h_coeff_x = c0*dt/mu_x # Update coefficients for Hx
h_coeff_y = c0*dt/mu_y # Update coefficients for Hy
e_coeff = c0*dt/eps  # Update coefficients for E

def update(half_step):
    global Hx, Hy, Ez
    if half_step:
        Hx += -h_coeff_x * (Ez[:, 1:] - Ez[:, :-1]) / dy
        Hy += h_coeff_y * (Ez[1:, :] - Ez[:-1, :]) / dx
    else:
        Ez[1:-1, 1:-1] += e_coeff[1:-1, 1:-1] * (
            (Hy[1:, 1:-1] - Hy[:-1, 1:-1]) / dx -
            (Hx[1:-1, 1:] - Hx[1:-1, :-1]) / dy
        )
        Ez[0, :] = Ez[-1, :] = Ez[:, 0] = Ez[:, -1] = 0.0  # Dirichlet BC

def run_simulation(steps):
    global Hx, Hy, Ez, MATERIALS
    hist_Hx, hist_Hy, hist_Ez = [], [], []
    hist_Hx.append(Hx.copy())
    hist_Hy.append(Hy.copy())
    hist_Ez.append(Ez.copy())

    for step in range(steps):
        update(1)  # Half-step for H
        update(0)  # Full-step for E
        if (step+1) % rec_interval == 0:
            hist_Hx.append(Hx.copy())
            hist_Hy.append(Hy.copy())
            hist_Ez.append(Ez.copy())
    return hist_Hx, hist_Hy, hist_Ez

def center_H(Hx, Hy):
    Hx_c = np.zeros((N, N))
    Hy_c = np.zeros((N, N))
    if N > 2: Hx_c[:, 1:-1] = 0.5 * (Hx[:, 1:] + Hx[:, :-1])
    Hx_c[:, 0] = Hx[:, 0]; Hx_c[:, -1] = Hx[:, -1]
    if N > 2: Hy_c[1:-1, :] = 0.5 * (Hy[1:, :] + Hy[:-1, :])
    Hy_c[0, :]  = Hy[0, :]; Hy_c[-1, :] = Hy[-1, :]
    return Hx_c, Hy_c

def visualise(hist_Hx, hist_Hy, hist_Ez, show_H=False, save=False):
    fig, ax = plt.subplots()
    Xc, Yc = np.meshgrid(np.arange(N) * dx + 0.5 * dx, np.arange(N) * dy + 0.5 * dy)

    # Material plots
    mat_rects = []
    for mat in MATERIALS:
        rect = ax.fill_between([mat[0], mat[1]], mat[3], mat[2], color=(abs(mat[4]-1)/9, 0, abs(mat[5]-1)/9, 0.5), edgecolor='k', linewidth=1.0, alpha=0.5, zorder=5)
        mat_rects.append(rect)

    # E and H plots
    im = ax.imshow(hist_Ez[0], origin='lower', extent=(0, X, 0, Y),
                   cmap='RdBu', vmin=-1.0, vmax=1.0, interpolation='bilinear', zorder=1)
    quiv = None
    if show_H:
        quiver_scale = 5.0
        quiver_width = 0.002
        quiver_color = (0, 0, 0, 0.5)
        Hx_c0, Hy_c0 = center_H(hist_Hx[0], hist_Hy[0])
        quiv = ax.quiver(Xc[::2, ::2], Yc[::2, ::2],
                         Hx_c0[::2, ::2], Hy_c0[::2, ::2],
                         scale=quiver_scale, pivot='mid', width=quiver_width, color=quiver_color, zorder=3)

    ax.set_xlabel('x'); ax.set_ylabel('y')
    ax.set_title('2D FDTD Simulation')
    ax.set_xlim(0, X); ax.set_ylim(0, Y)
    cb = plt.colorbar(im, ax=ax, fraction=0.046, pad=0.04)

    time_text = ax.text(0.02, 0.95, '', transform=ax.transAxes, color='k')

    def animate(i):
        im.set_array(hist_Ez[i])
        if show_H:
            Hx_c, Hy_c = center_H(hist_Hx[i], hist_Hy[i])
            quiv.set_UVC(Hx_c[::2, ::2], Hy_c[::2, ::2])
        time_text.set_text(f't = {i * dt:.4f}s')
        return [im, time_text, *mat_rects] + ([quiv] if show_H else [])
    ani = animation.FuncAnimation(fig, animate, frames=len(hist_Ez), interval=10, blit=True)
    if save:
        ani.save('output.gif', writer='ffmpeg', fps=30)
    plt.show()

hist_Hx, hist_Hy, hist_Ez = run_simulation(int(T/dt))
visualise(hist_Hx, hist_Hy, hist_Ez, show_H=True, save=True)

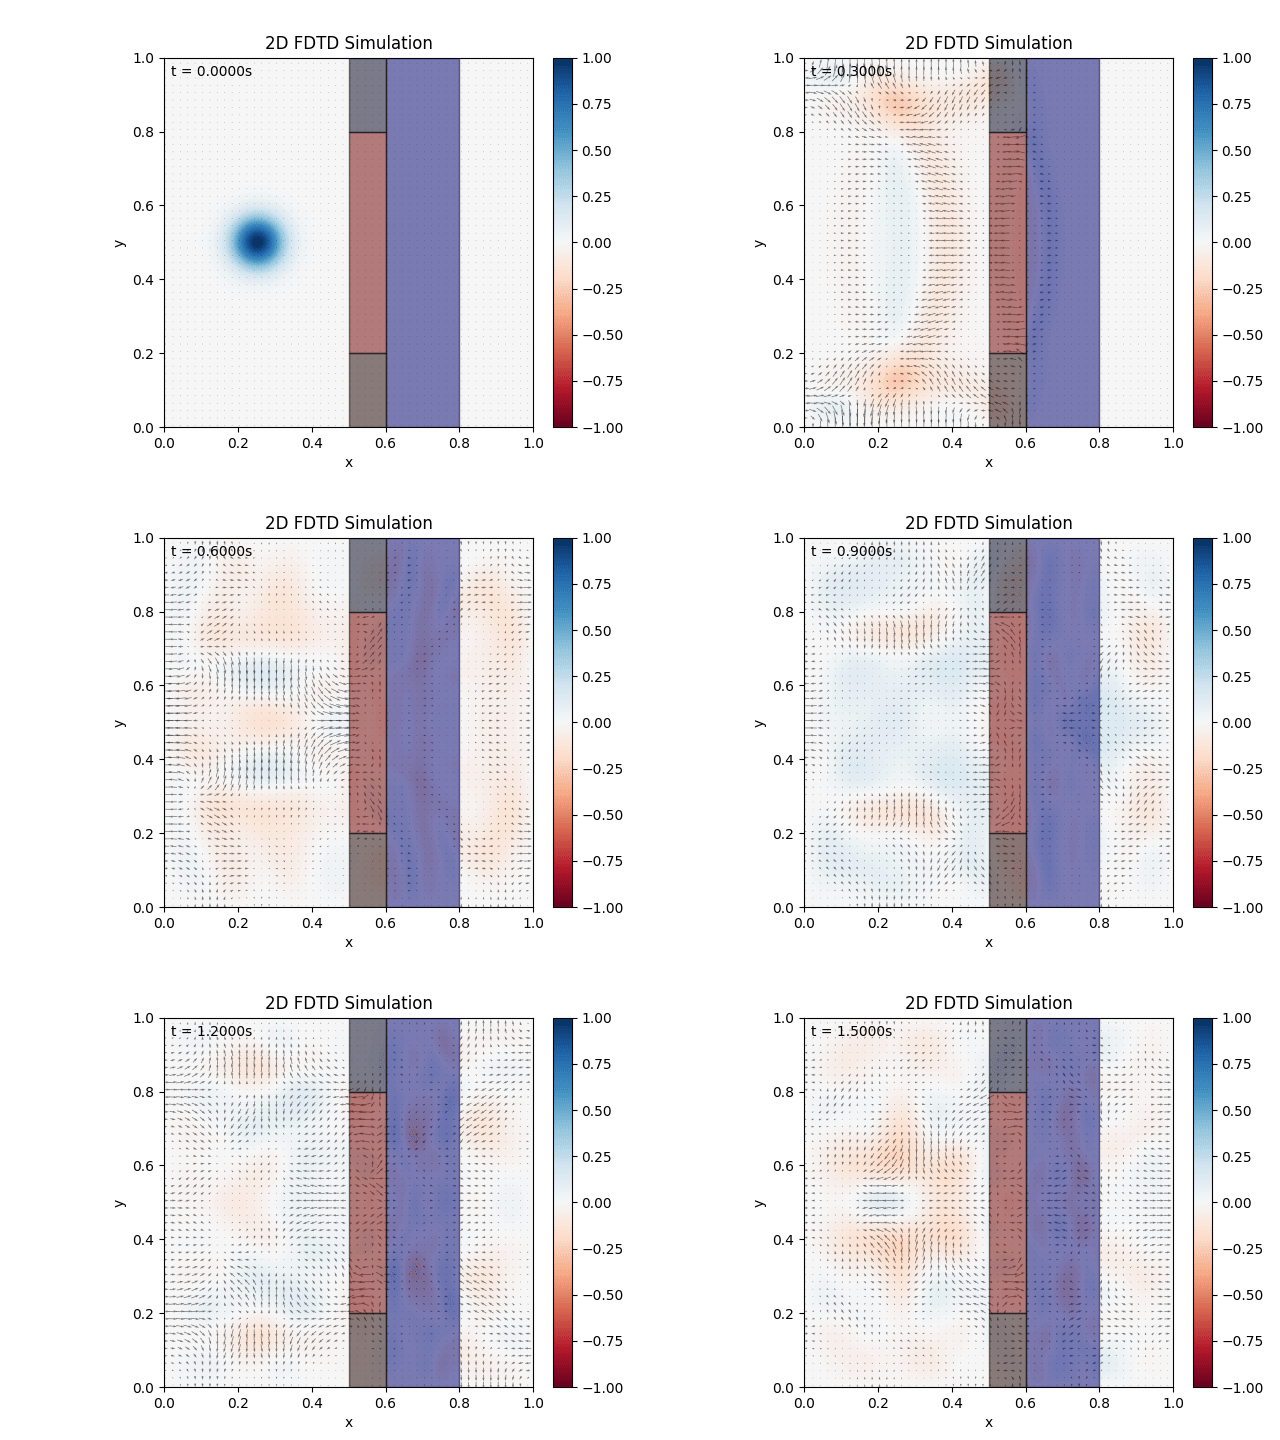
Seems to be working as expected. Testing combination of materials:
