Derivation of Update Equations
Expanding the two curl equations:
We assume “diagonally anisotropic” materials (and later isotropic materials) - i.e. working in crystal axes of the permittivity and permeability tensors - so off-diagonal entries in the permittivity/permeability vanish:
Since we are working 1D, we set $\frac{ \partial }{ \partial y }=\frac{ \partial }{ \partial z }=0$, and have the simulation run on the x-axis. With this, the curl equations simplify into (leaving out the ones of the form $0=\text{RHS}$):
The first and last interact, while the 2nd and 3rd interact. This is the decoupling into the $E_z$-$H_y$ mode and the $E_y$-$H_z$ mode mentioned previously in setup.
To simplify things further, for isotropy ($\mu_{yy}=\mu_{zz},\, \varepsilon_{yy}=\varepsilon_{zz}$), the two equations describe the same thing (by inspection). Hence only necessary to solve one ($E_z$-$H_y$).
Following the same discretisation, we have
for the magnetic field at position $i$, and
These are the update equations.
Implementation
Free Space
import numpy as np
import matplotlib.pyplot as plt
import scipy.integrate as spi
import matplotlib.animation as animation

N = 500  # Number of grid points
dx = 0.01  # Spatial step
dt = 0.01  # Time step
T = 50.0  # Total time
c0 = 1.0  # Speed of light

H = np.zeros(N)  # Magnetic field (y)
E = np.zeros(N)  # Electric field (z)

eps = 1.0  # Permittivity
mu = 5  # Permeability
h_coeff = c0*dt/(mu*dx)  # Update coefficient for H
e_coeff = c0*dt/(eps*dx)  # Update coefficient for E

def update(half_step):
    global H, E
    if half_step:
        for i in range(0, N-1):
            H[i] += h_coeff * (E[i+1] - E[i])
    else:
        for i in range(1, N):
            E[i] += e_coeff * (H[i] - H[i-1])

def run_simulation(steps):
    global H, E
    hist_H = np.zeros((steps, N))
    hist_E = np.zeros((steps, N))
    for step in range(steps):
        update(1)
        hist_H[step] = H.copy()
        update(0)
        hist_E[step] = E.copy()

    fig, ax = plt.subplots()
    line_H, = ax.plot(np.arange(N) * dx, hist_H[0], label='H(y)')
    line_E, = ax.plot(np.arange(N) * dx, hist_E[0], label='E(z)')
    ax.set_xlabel('Position (x)')
    ax.set_ylabel('Field Value')
    ax.set_title('1D FDTD Simulation')
    ax.set_xlim(0, N * dx)
    ax.set_ylim(-1, 1)
    ax.grid()
    ax.legend()

    time_text = ax.text(0.02, 0.95, '', transform=ax.transAxes)

    def animate(i):
        line_H.set_ydata(hist_H[i])
        line_E.set_ydata(hist_E[i])
        time_text.set_text(f't={i*dt:.2f}s')
        return [line_H, line_E, time_text]
    anim = animation.FuncAnimation(fig, animate, frames=steps, interval=10, blit=True)

    plt.show()

def create_gaussian_pulse(c, r, A=1.0):
    t = np.linspace(0, N*dx, N)
    return A * np.exp(-((t-c)**2)/(2*r**2))

E = create_gaussian_pulse(N*dx/2, 0.1, 1.0)

run_simulation(int(T//dt))
Most of this is as described exactly in the theory. Note that the coefficients literally don’t matter so I set $c_0=1$.
Furthermore, stability analysis shows that it isn’t enough to just perform a ‘hard source’ injection by setting E[N//2] = 1.0, since the large gradient between adjacent grid points causes numeric instability. Hence, I wrote a Gaussian pulse to be instantiated at $t=0$ as a ‘hard source’.
The above code outputs the following:
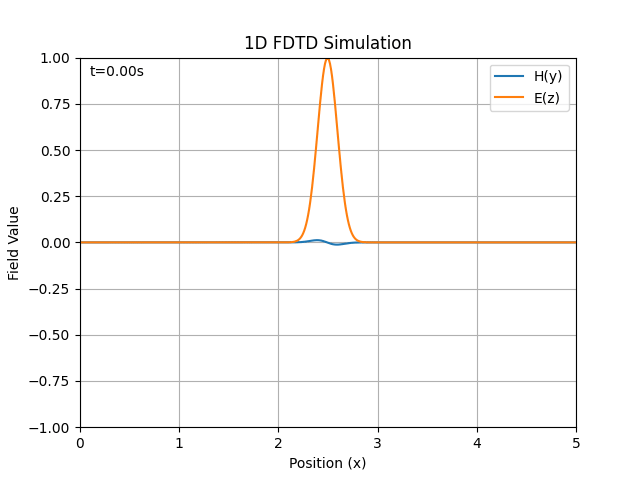
Seems relatively numerically stable, and also behaves as expected with Dirichlet boundary conditions. Turned the permeability to $\mu=5$ so that the H field looks different to the E field for testing purposes.
Materials Testing
Now turning eps and mu into arrays, as well as the update coefficients in order to test behaviour within different materials (and boundary conditions along those materials).
import numpy as np
import matplotlib.pyplot as plt
import scipy.integrate as spi
import matplotlib.animation as animation

N = 500  # Number of grid points
dx = 0.01  # Spatial step
dt = 0.01  # Time step
T = 10.0  # Total time
c0 = 1.0  # Speed of light

H = np.zeros(N)  # Magnetic field (y)
E = np.zeros(N)  # Electric field (z)

def create_gaussian_pulse(c, r, A=1.0):
    t = np.linspace(0, N*dx, N)
    return A * np.exp(-((t-c)**2)/(2*r**2))
E = create_gaussian_pulse(N*dx/2, 0.1, 1.0)

eps = np.ones(N)  # Permittivity
mu = np.ones(N)  # Permeability

def create_material(start, end, permittivity=1.0, permeability=1.0):
    global eps, mu
    start_idx = int(start / dx)
    end_idx = int(end / dx)
    eps[start_idx:end_idx] = permittivity
    mu[start_idx:end_idx] = permeability
MATERIALS = [
    (3.5, 4.5, 1.0, 5.0)
]
for i in MATERIALS:
    create_material(*i)

h_coeff = c0*dt/(mu*dx)  # Update coefficients for H
e_coeff = c0*dt/(eps*dx)  # Update coefficients for E

def update(half_step):
    global H, E
    if half_step:
        for i in range(0, N-1):
            H[i] += h_coeff[i] * (E[i+1] - E[i])
    else:
        for i in range(1, N):
            E[i] += e_coeff[i] * (H[i] - H[i-1])

def run_simulation(steps):
    global H, E, MATERIALS
    hist_H = np.zeros((steps, N))
    hist_E = np.zeros((steps, N))
    for step in range(steps):
        update(1)
        hist_H[step] = H.copy()
        update(0)
        hist_E[step] = E.copy()

    fig, ax = plt.subplots()

    for i in MATERIALS:
        ax.axvspan(i[0], i[1], color=((i[2]-1)/9, 0, (i[3]-1)/9, 0.5))

    line_H, = ax.plot(np.arange(N) * dx, hist_H[0], label='H(y)')
    line_E, = ax.plot(np.arange(N) * dx, hist_E[0], label='E(z)')
    ax.set_xlabel('Position (x)')
    ax.set_ylabel('Field Value')
    ax.set_title('1D FDTD Simulation')
    ax.set_xlim(0, N * dx)
    ax.set_ylim(-1, 1)
    ax.grid()
    ax.legend()

    time_text = ax.text(0.02, 0.95, '', transform=ax.transAxes)

    def animate(i):
        line_H.set_ydata(hist_H[i])
        line_E.set_ydata(hist_E[i])
        time_text.set_text(f't={i*dt:.2f}s')
        return [line_H, line_E, time_text]
    anim = animation.FuncAnimation(fig, animate, frames=steps, interval=10, blit=True)

    plt.show()

run_simulation(int(T//dt))
Added a way of adding regions of materials with particular $\varepsilon$ and $\mu$ values, as well as a visualiser for the materials in the form of shaded regions, where more red means higher permittivity, and more blue means higher permeability.
N.B. I assume that $\max(\max_i(\varepsilon),\max_i(\mu))=10$ for now.
Running this with a test material as seen in the program gives:
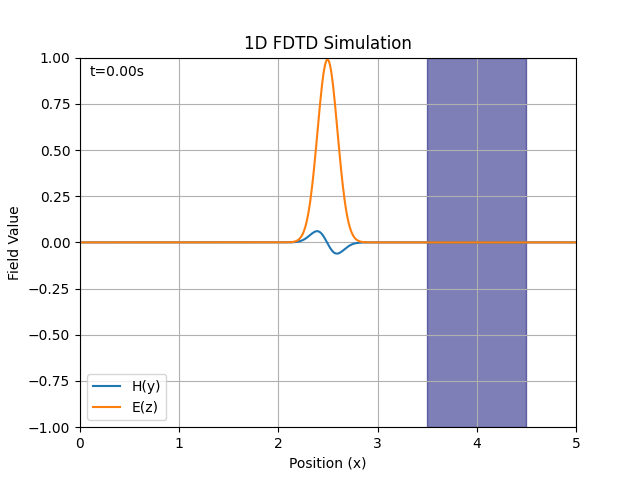
which I am overwhelmingly happy with.
Issues
There is a ‘quirk’ with the simulation, being that as soon as $dx$ is low enough to force the update coefficients to exceed 1, the simulation explodes and numerically diverges extremely quickly. Not exactly sure why but there’s no problem if you don’t see it right team?
This fixes itself when:
- $dx$ is increased, or
- $dt$ is decreased, or
- $\varepsilon$ and $\mu$ are decreased to compensate It’s highly unintuitive that a smaller $dx$ somehow causes it to be less numerically stable… but I think the fundamental problem lies in what happens when the update coefficient exceeds 1.
What’s stranger is one update coefficient can be less than 1 while another is greater than 1, and it might still be stable (if the one that’s greater is able to ‘compensate’ somehow).